
Back in August, I wrote a piece arguing that Conversion Rate, the go-to metric for most tournament post-mortems, was telling an incomplete story. The short version: a deck with many pilots tends to cannibalize itself over the course of a long tournament, particularly through cuts as the higher likelihood of mirror matches means one must always lose and penalize the overall deck performance. A somewhat better solution is Performance Rate, which measures how much a deck’s share of the field changes across tournament thresholds, but the solution that I proposed in the end is Adjusted Performance Rate, which normalizes that change logarithmically for sample size so small-field and large-field decks can be compared on equal footing.
If you haven’t read that piece, the math is in the footnotes. If you have, you already know the punchline: the most popular decks and the most successful decks don’t always overlap, and APR is the clearest way to quantify exactly how far apart they are.
Now we have some A Lawless Time PQ data from SWU Competitive Hub: 16 Premier events, all above 32 players, totaling 911 competitors, 128 top-8 slots, and 16 winners. That’s not a Galactic Championship, but it’s enough to run the numbers, and the numbers have things to say that the raw stats are too polite to mention.
The Setup: Two Thresholds, Not One
At Galactics, we have multiple day transitions to analyze. At PQs, the equivalent breakpoints are simpler: Field → Top 8 → Win. Two stages, each telling a different piece of the story. The baseline win rate expectation from Top 8 is 12.5%: one win per eight seats. Any deck consistently above that is closing better than expectation; any deck below is cashing out before the trophy gets handed over.
Field estimates are derived from SWU Meta Stats’ home-page meta share percentages applied against the 911-player Hub total. All Top 8 and win counts come directly from Hub event records, confirmed by tallying the 16 individual events. A combined 244 players ran decks that didn’t register a single Top 8 appearance; they’re accounted for as a residual block so the columns balance cleanly, but they don’t factor into the analysis below.
Stage One: Getting to Top 8
This is where most meta conversation lives, and it’s also where most meta conversation misses the point. Counting raw Top 8 appearances without adjusting for field representation rewards popular decks just for showing up. APR cuts through that.
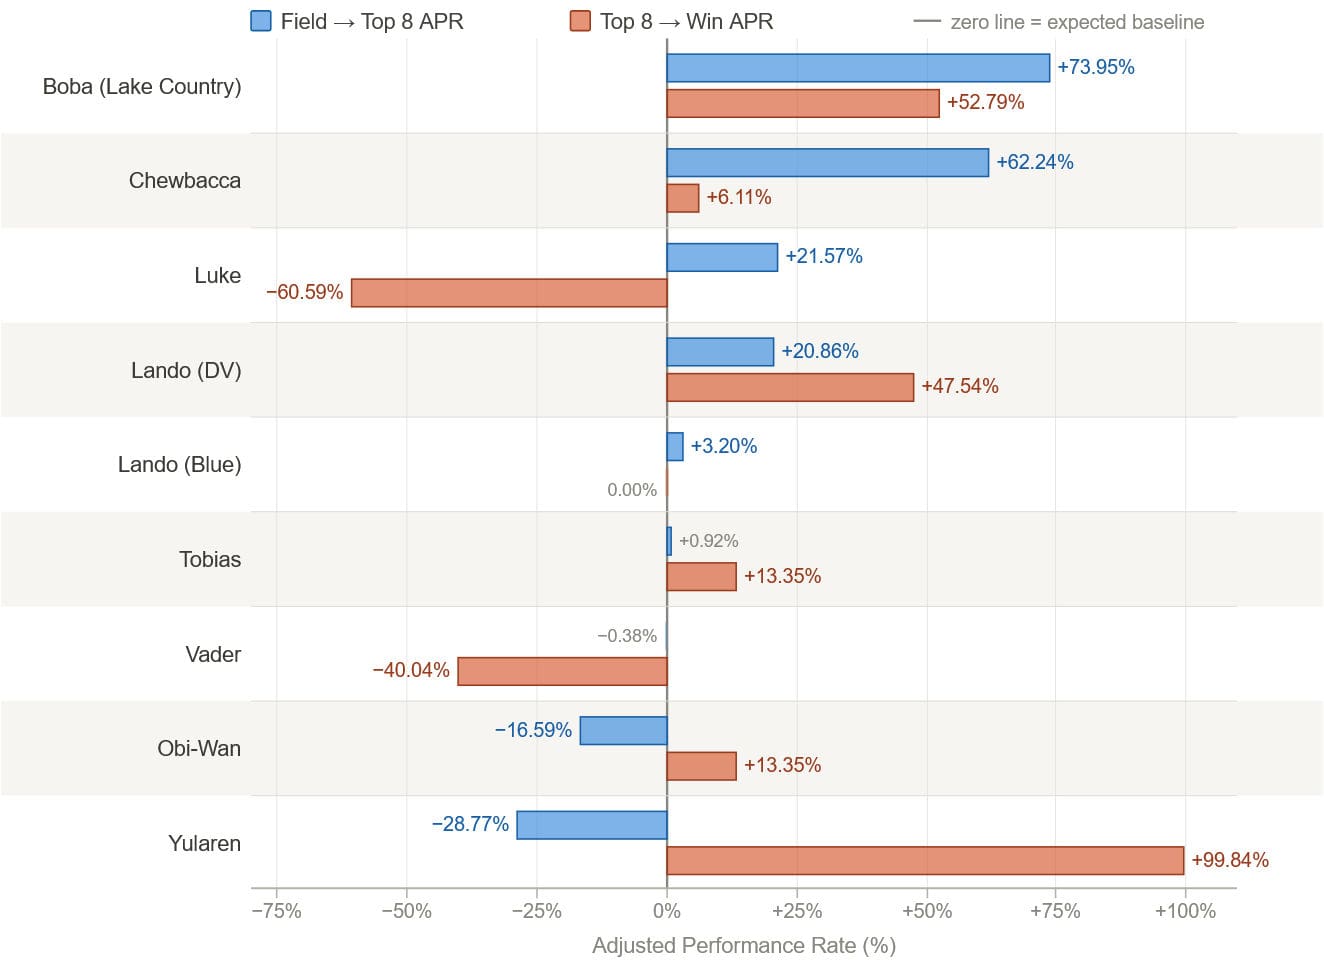
Here are the major archetypes sorted by Field → Top 8 APR:
| Archetype | Field% | T8 | T8% | F→T8 APR |
| Boba Fett / Lake Country | 7.90% | 22 | 17.19% | +73.95% |
| Chewbacca / Yellow | 2.31% | 7 | 5.47% | +62.24% |
| Lando Calrissian / Data Vault | 1.54% | 3 | 2.34% | +20.86% |
| Luke Skywalker / Data Vault | 10.65% | 18 | 14.06% | +21.57% |
| Aurra Sing / Red | 0.99% | 2 | 1.56% | +19.65% |
| Qui-Gon Jinn / Green Force | 1.21% | 2 | 1.56% | +10.72% |
| Mother Talzin / Red Force | 1.43% | 2 | 1.56% | +3.68% |
| Lando Calrissian / Blue | 5.93% | 8 | 6.25% | +3.20% |
| Tobias Beckett / Red | 4.61% | 6 | 4.69% | +0.92% |
| Mother Talzin / Yellow Force | 1.54% | 2 | 1.56% | +0.67% |
| Admiral Piett / Blue | 1.54% | 2 | 1.56% | +0.67% |
| Darth Vader / Yellow | 4.72% | 6 | 4.69% | -0.38% |
| Darth Maul / Blue Force | 2.63% | 3 | 2.34% | -5.21% |
| Boba Fett / Yellow | 3.73% | 4 | 3.13% | -8.49% |
| Vel Sartha / Red 27HP | 1.98% | 2 | 1.56% | -9.04% |
| Jyn Erso / Red 27HP | 2.31% | 2 | 1.56% | -14.61% |
| Obi-Wan Kenobi / Vergence Temple | 6.48% | 6 | 4.69% | -16.59% |
| Colonel Yularen / Red 27HP | 2.20% | 1 | 0.78% | -28.77% |
The headline at Stage One isn’t Boba. Everyone already knew he was overperforming. The headline is Chewbacca Yellow at +62.24%. He’s getting to the final table at nearly Boba-tier efficiency while occupying less than a quarter of the field representation. That’s the kind of number you see when a deck is strong and the field isn’t accounting for it yet.

For what it’s worth, early content creator perspectives seemed suspicious that Chewbacca may be one of the top leaders in the set with real untapped potential to shine. The APR is now confirming what the pre-season read predicted: this deck earns its table far more often than its field presence suggests. Noting the high win percentage for Chewbaccas as well, the community had the right instinct; the numbers are just putting a figure on it.
Luke’s stage-one number, +21.57%, deserves its own explanation. He’s the most-represented deck at 10.65% of the field, so some APR compression from mirror matchups is expected. But here’s the structural reason why Luke keeps getting to tables: he’s the only space deck that’s immune to upgrade removal, he’s the built-in counter to the format’s second-most-popular pilot strategy in Vader, and he’s an iconic character on a low-complexity build that lots of people already own and know how to play. All three of those factors pump his field numbers and explain his solid but not spectacular +21.57% field-to-cut conversion. His problem is on the other side.
Stage Two: Closing from Top 8
The baseline win rate from a Top 8 seat is 12.5%. One in eight. What happens when we cross from “made the cut” to “lifted the trophy” is where the most interesting patterns live.
| Archetype | T8 | Wins | Win% | T8→Win APR |
| Colonel Yularen / Red 27HP | 1 | 1 | 6.25% | +99.84% |
| Mother Talzin / Yellow Force | 2 | 1 | 6.25% | +67.82% |
| Mother Talzin / Red Force | 2 | 1 | 6.25% | +67.82% |
| Vel Sartha / Red 27HP | 2 | 1 | 6.25% | +67.82% |
| Qui-Gon Jinn / Green Force | 2 | 1 | 6.25% | +67.82% |
| Boba Fett / Lake Country | 22 | 5 | 31.25% | +52.79% |
| Lando Calrissian / Data Vault | 3 | 1 | 6.25% | +47.54% |
| Boba Fett / Yellow | 4 | 1 | 6.25% | +33.12% |
| Tobias Beckett / Red | 6 | 1 | 6.25% | +13.35% |
| Obi-Wan Kenobi / Vergence Temple | 6 | 1 | 6.25% | +13.35% |
| Chewbacca / Yellow | 7 | 1 | 6.25% | +6.11% |
| Lando Calrissian / Blue | 8 | 1 | 6.25% | +0.00% |
| Darth Vader / Yellow | 6 | 0 | 0.00% | -40.04% |
| Darth Maul / Blue Force | 3 | 0 | 0.00% | -28.53% |
| Jyn Erso / Red 27HP | 2 | 0 | 0.00% | -22.61% |
| Admiral Piett / Blue | 2 | 0 | 0.00% | -22.61% |
| Luke Skywalker / Data Vault | 18 | 0 | 0.00% | -60.59% |
The number that should stop you cold: Luke Skywalker’s T8→Win APR of -60.59% from 18 Top 8 appearances. Eighteen cracks at the title. Zero trophies. That -60.59% is not a rounding error or small-sample noise; it’s calculated from the largest single-deck Top 8 count in the dataset. Something structural is happening specifically in elimination.

The content creator landscape actually handed us a clue about why before we could see it in the numbers. Luke is a deck that has seen a lot of coverage both in play and in testing against. Everyone is calling it out as one of the most important decks in the format to test against, with some full on calling it an S-Tier deck. Here’s the thing though, players who are preparing for this format are preparing for Luke. If the subset of players disciplined enough to survive Swiss in a 40-to-100-player event are also the players who looked to Luke as their S-tier target practice, you’d expect him to run straight into these bad matchups in cut. That’s exactly what the -60.59% APR is showing.
Boba Lake Country’s T8→Win APR of +52.79% is the fifth-highest in the format, from the largest sample by a wide margin. The four archetypes above him each have one or two Top 8 appearances. Boba produced +52.79% from 22 appearances, having already posted +73.95% to get there. That is a two-stage juggernaut, and the raw match data shows it as well: 394 wins to 277 losses in tracked matchups, with nearly every individual matchup in the green; Tobias was the only exception. Boba is the dominant force in this meta and does not seem to be showing the same prep against it hit that Luke is showing.

Some folks have recently expressed that Topple the Summit may be a problem card with the plot mechanic enabling action cheating and the effect on top of damage from Boba leads to some wild board swings and unbalanced resets. I’m not sure I’m ready to call for a ban yet, but the performance of the Boba deck is so extreme that there is clearly something at work here. If players aren’t able to compensate for the Boba matchup and bring his numbers down in the next couple of weeks, I do think it’s a strong candidate for action. One card might not entirely explain a +73.95% Field→Top 8 APR and a +52.79% Top 8→Win APR, but I think it’s very much worth watching..
Lando Blue at exactly +0.00% T8→Win APR is one of my favorite data points in the whole set. One win from eight Top 8 appearances, hitting the 12.5% baseline precisely. That’s the statistical portrait of a well-calibrated meta deck: not warping anything, not collapsing, just doing exactly what it’s supposed to do. If you need a floor to build against, there it is.

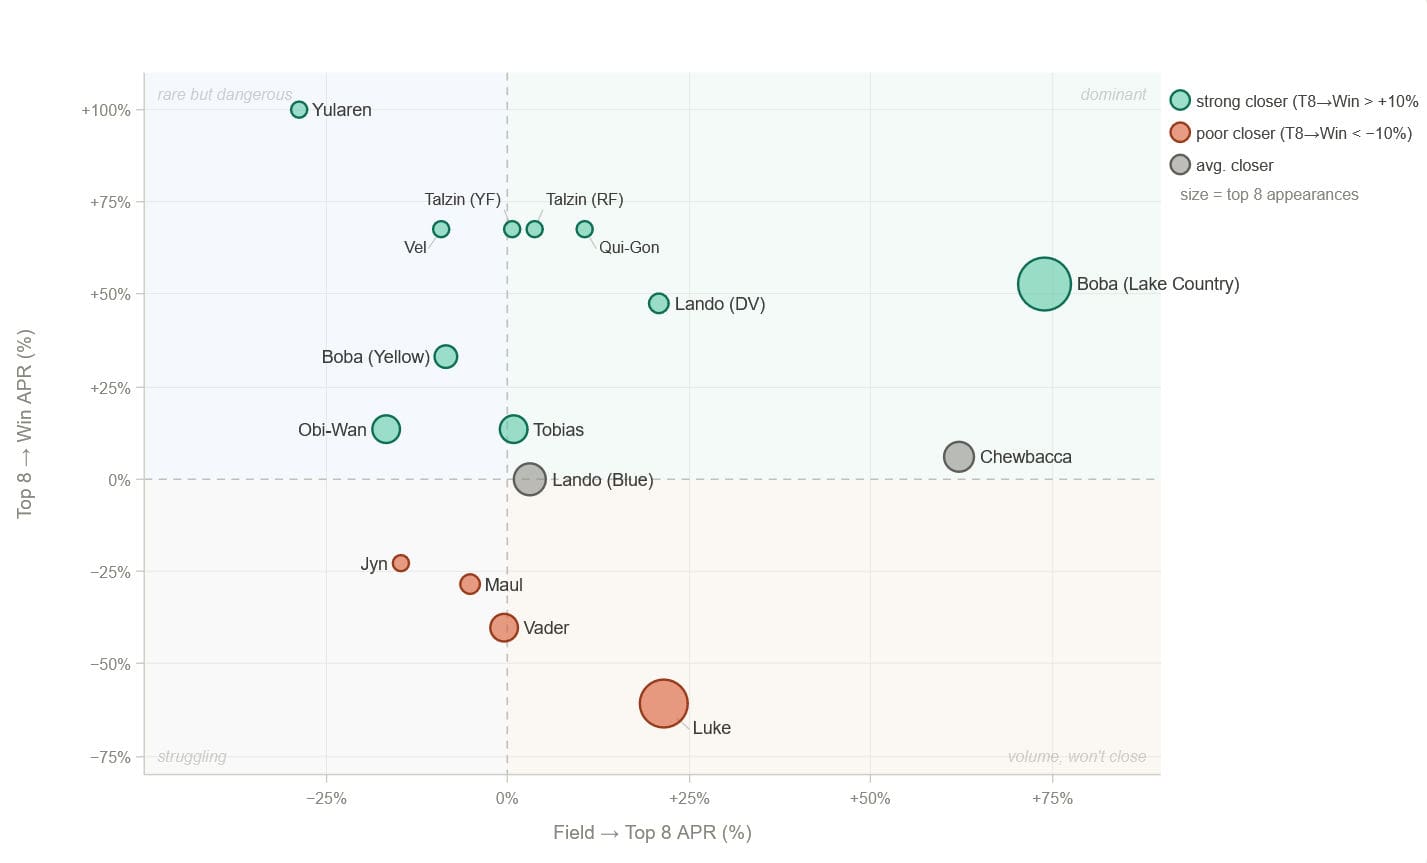
The Two-Stage Portrait
Boba Fett / Lake Country (+73.95% / +52.79%). The only deck showing large positive APR at both stages from a meaningful sample. Getting to the table above expectation; leaving with the trophy even above that expectation. This is the clearest definition of a format problem the numbers can produce.
Chewbacca / Yellow (+62.24% / +6.11%). One of the most intriguing profiles in the data. Getting to Top 8 at near-Boba efficiency from a field share less than a quarter of Luke’s, then going essentially flat at the closing stage. This seems to be a deck that the field hasn’t figured out how to counter yet and with even less people piloting it. The +6.11% T8→Win APR suggests the Top 8 players are still finding those answers once the preparation filter kicks in. Figure out the closing game and you’ve found something real.
Luke Skywalker / Data Vault (+21.57% / -60.59%). Gets to the table above expectations, goes 0-for-18 in wins. The structural explanation here seems to be that Luke was the most-targeted deck entering PQ season. Every competitive player who made it through Swiss already had a plan for him. Lando Blue was co-S-tier in the community’s pre-season read; it specifically feasts on Luke in cut matchups. The players surviving to Top 8 aren’t a random sample; they’re a filtered sample, and that filter loads the bracket against a deck the whole field practiced beating.
Darth Vader / Yellow (-0.38% / -40.04%). Dead flat getting to the table, then six appearances with nothing to show for it. Vader’s win rate stays afloat because it has a lot of nearly free wins against decks that don’t compete in space or pack early forms of mass removal. However, the decks giving him those free wins in Swiss are the same decks that filter out before Top 8. What’s left for him in cut is the field’s hardest matchups: Luke’s built-in ping dismantles the Victor Leader/Clone Combat Squadron engine and picks off Tie tokens, and Boba’s indirect damage strategy runs circles around his pieces as well. He’s not being locked out of the cut. The format just doesn’t hand out free wins in Top 8.

Food for thought, though, if Boba and Luke were to exit the format and Vader were to remain, he would simply step into their role against the ground decks. The -40.04% T8→Win APR isn’t evidence that Vader is weak; it’s evidence that he’s currently being suppressed by the two decks above him on the food chain.
Lando Calrissian / Data Vault (+20.86% / +47.54%). Both stages above expectations from a small but meaningful sample. With hard control essentially absent from the meta right now, the Data Vault split of Lando is operating in exactly the environment that would suit this type of midrange ramp/beatdown. The +47.54% T8→Win APR on three appearances isn’t a sample size you can hang your hat on alone, but it’s coherent with the matchup logic.
Tobias Beckett / Red (+0.92% / +13.35%). Steady at both stages. Flat entry with no self-cannibalization from high field representation, and above-baseline closing. Much like Han before it, Tobias has taken a bit to figure out. I do believe people accurately point out that it’s a fairy intensive deck to run from the perspective of maximizing your decision points and not mistepping in what/when you donate things to your opponent. But here’s the thing, the folks that are dedicated enough to stick it out and pilot it are proving that they have put in the work to understand it. The APR profile is consistent with a mastery-dependent deck in an early adoption curve. The pilots who brought it knew what they were doing; the results followed. It’s also not a one-trick pony and that helps explain why the flat field stage doesn’t mask any hidden bad matchup problem the way it might for a more one-dimensional strategy.

Obi-Wan Kenobi / Vergence Temple (-16.59% / +13.35%). Underperforming getting to the cut, then converting above baseline once there. The classic high-variance cheese pattern. Look, a big chunk of this deck operates on trying to high roll an opening hand of Jedi Consular into a five drop in order to really operate at its ceiling. The -16.59% F→T8 APR reflects all the Swiss rounds where the deck didn’t find its opener. The +13.35% T8→Win APR reflects the fact that the versions that did make Top 8 were overwhelmingly the versions that had already assembled the Turn 1 Consular and snowballed off it. When you filter for the hands that worked, the deck still knows how to win.

Colonel Yularen / Red 27HP (-28.77% / +99.84%). The most dramatic two-stage split in the dataset, and probably the most important outlier for forward-looking preparation. Getting to Top 8 well below field-share expectations: one appearance from 2.20% of the field. That one appearance converted into a win at a +99.84% adjusted rate. The -28.77% F→T8 APR probably reflects the deck’s difficulty curve combined with genuine field unpreparedness for a disciplined villainous aggro build. When someone who knows it thoroughly shows up with it, the results can be extraordinary. The +99.84% is a one-event number, but the matchup logic doesn’t contradict it. I think this is another deck that shows the most potential for players to really get in and explore. With more pilots, can he turn that Field→T8 APR around? Or will he be consigned to hope for a lucky Swiss run, but then prey on the types of decks that make Top 8? Can he pull off at least Chewbacca style numbers in a larger sample or will he settle into something closer to Vader?

Mother Talzin (both variants, +67.82% T8→Win APR each). Looking at the rest of the field, the Talzin builds that actually won are clearly the Talzins that prepared for the Lukes, Bobas, and Vaders of the world and put those anti-space cards in the main deck. The implication is significant for understanding the +67.82% closing APR. The Talzin pilots who survived Swiss to make Top 8 weren’t running the stock mid-range/control build; they were the players who had already committed pre-sideboard to answering the format’s dominant threats. A deck that enters the Top 8 already pre-built for the meta’s hardest matchups has a structural advantage in elimination. When Talzin makes it, she closes. The question has always been getting there.

What This Changes About the Conversation
Boba and Luke are not the same tier of problem. They look equivalent in raw Top 8 counts: 22 and 18 respectively. Their APR profiles tell a completely different story. Boba dominates at both stages. Luke underperforms at the stage that matters most. A response that treats them symmetrically is overreacting to Luke and underreacting to Boba.
Chewbacca is the most underrated deck in the format by these numbers. His +62.24% Field→Top 8 APR from only 2.31% field share is the clearest signal that the field hasn’t zeroed in on him yet. Early chatter about him seemed favorable, but the problem is that nobody brought him in sufficient volume for the numbers to scream it, which makes APR the only lens that surfaces the signal.
Vader’s reputation is outrunning his results. Six Top 8 appearances producing zero wins, with the matchup logic fully explaining why. His path to a respectable win rate runs entirely through the decks that filter out before cut. There are good reasons to be worried about what happens if the format changes around him, but in the current configuration, the data is clear.
The Tobias mastery pipeline is tracking. The APR profile at both stages is consistent with a deck in early adoption: not yet inflated by field volume, converting at above-baseline rates when piloted by players who’ve done the work. This is a pattern worth monitoring as the season extends and the learning curve flattens.
Lando Data Vault deserves more serious testing. Two positive APRs across two stages, in an environment that the matchup logic says suits it perfectly. Worriers about his top end are likely missing the mark for a meta where slow control isn’t showing up.
The PQ sample is still small by major-event standards. These numbers will sharpen as the season extends. But 16 events and 911 players is enough to tell us that the raw Top 8 counts are only giving you half the story, and the half they’re omitting is often the more important half.
Conversion Rate (CR) = Top 8 appearances ÷ Field entries. Performance Rate (PR) = (Stage 2 field share − Stage 1 field share) ÷ Stage 1 field share. Adjusted Performance Rate (APR) = PR × (log(n+1) ÷ log(N+1)), where n is the archetype count at the prior threshold and N is the total participants at that threshold. Field estimates derived from Meta Stats home-page meta share × 911 Hub total players. Top 8 and win counts from SWU Competitive Hub, 16 Premier events, each >32 players. Data as of April 5–6, 2026.