


Galactics is less a week out now, and I wanted to get a numbers-heavy piece out before everyone starts traveling, so here’s everything the Karabast data has told us since Ashes hit the ladder. Alex and I also recorded a podcast episode last week covering some different ground on this same topic, his insight included, if you want that take too -I swear, this isn’t a carbon copy of that episode. This article brings a few things to the table that we didn’t have time to hit in the episode and a couple new T8 scenarios I added for good measure, so let’s get into the numbers.
A quick word on the data before anything else: this is Karabast, which means online, which means best-of-one. That’s not the same animal as a paper best-of-three bracket at a 600 player event, so treat everything below as a read on trajectory and matchup shape, not gospel. Big thanks to SWUStats for the API access that makes tracking this stuff possible at all. We’re pulling weeks 38 through 42 — 38 being the first week Ashes cards were legal on Karabast — across a tracked field that’s grown from about 20 recognized decks to 43 as the format’s settled in.
One more note on sourcing: the Karameta site got pointed out to me after I was already deep into this work, and it’s worth a look too. Our starting sample methods aren’t quite the same, so don’t expect the raw figures to line up exactly between the two. That said, most of the trend information holds up across both, which is a decent sign neither of us is chasing noise.
Cad’s Still the King, But Check the Crown
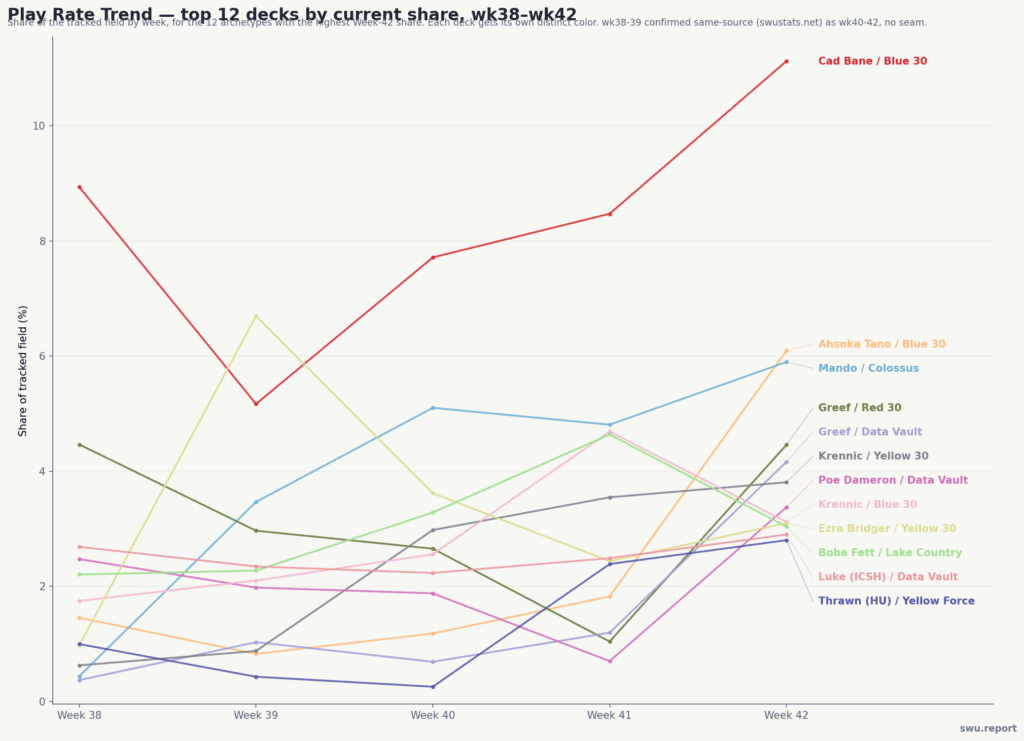
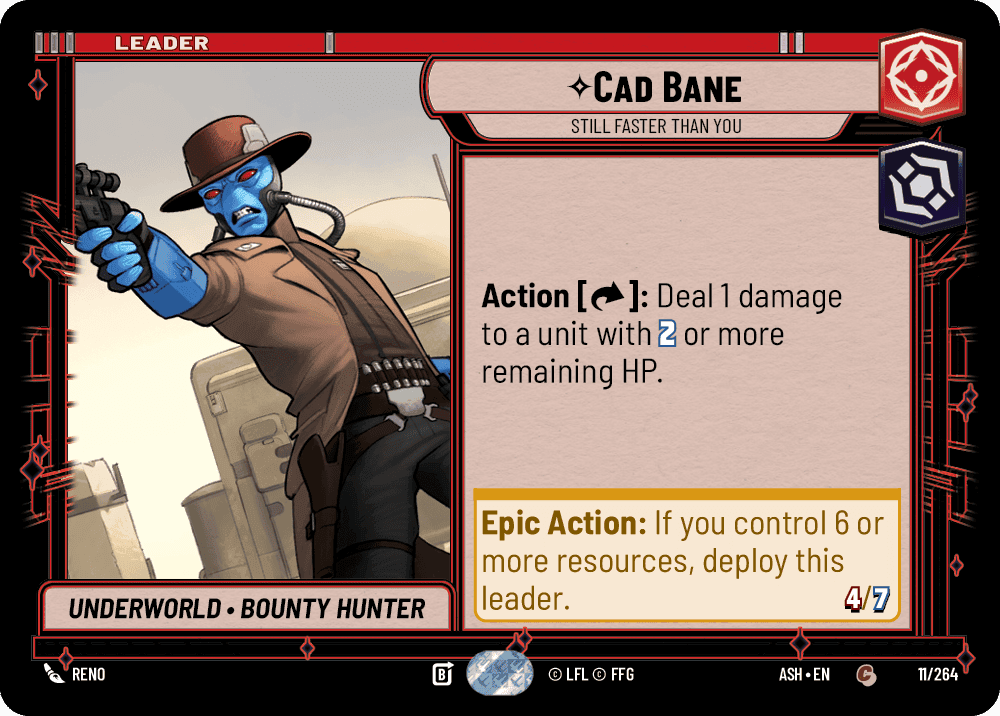
Cad Bane / Blue 30 is sitting at 11.1% of the tracked field in week 42. That’s not close to second place. On any trend chart you build from this data, his is the line that makes everything else look flat.
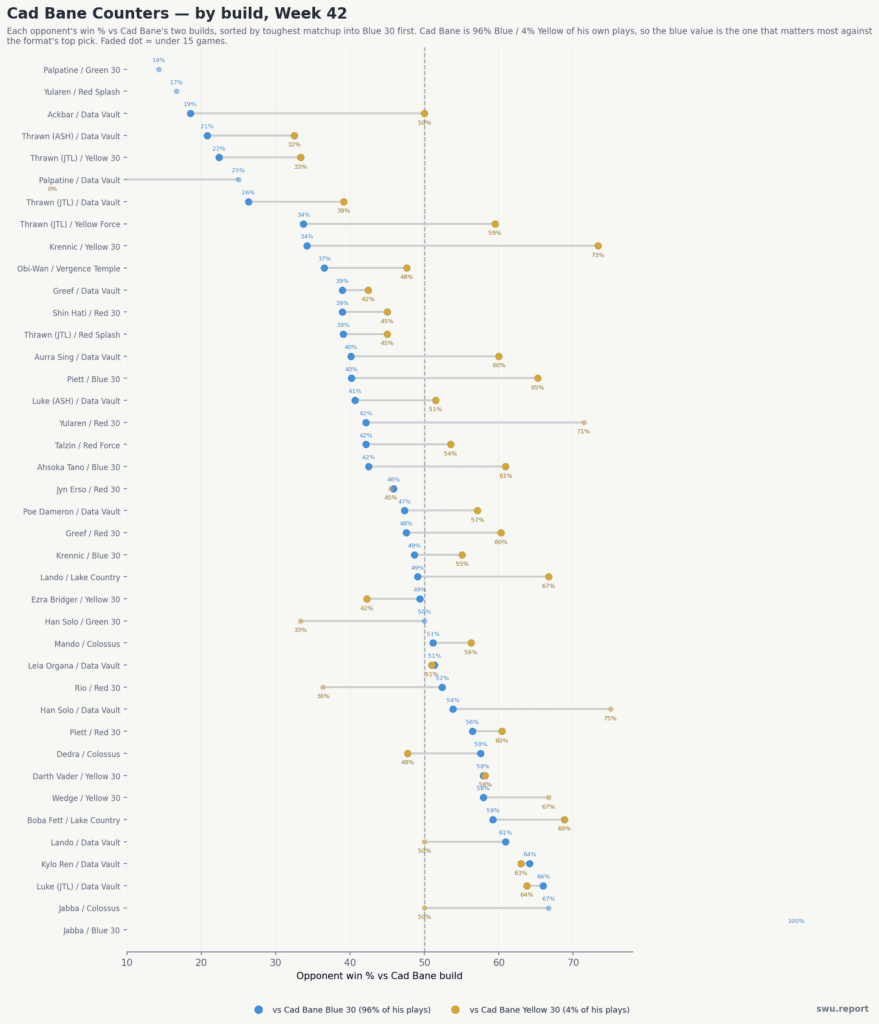
Here’s the thing worth sitting with, though: run the actual win-rate math and his results don’t quite stack up to that play rate. His win rate against the tracked field (52.9%) doesn’t clear the bar his share would suggest it should. Sure, he’s still good — nobody’s arguing otherwise. He’s just not so good that “everyone’s on him” is fully backed by results rather than hype. If Cad were actually over the top the way Boba or Lando were at points in the LAW era, you’d expect the win rate to be running away from the field the same way the play rate is. It isn’t.
Positive matchups against both his Blue and Yellow builds, for the record, and none of these are rogue picks:
- Luke Skywalker (JTL) / Data Vault — north of 60% into both colors, and it isn’t close
- Boba Fett / Lake Country — 59.2% into Blue, a wild 68.8% into Yellow
- Darth Vader (JTL) / Yellow 30 — just under 60% into both
- Admiral Piett / Red 30 — also positive into both, and I’d bet the heavy-space-aggro shape of that deck has something to do with it
These are established decks with real pedigree beating the format’s most popular deck at a real clip. That’s the strongest evidence I’ve got that Cad isn’t oppressive so much as popular, and it raises a question worth pondering going into the weekend: if this kind of analysis gets in front of enough pilots, does it change what people actually sleeve up? I don’t have a model for that. Nobody does. It’s the oldest problem in any metagame — the moment your read becomes public, it starts changing the thing you were reading.
The Real Risers (And Why Cad’s Growth Is Softer Than It Looks)
Track raw play-share week over week and almost every archetype in the tracked field looks like it’s trending up, because the tracked field itself has been growing. More decks earn a consistent sample, and more of Karabast’s population landon recognized archetypes as the format matures. Cad’s raw share growth is riding some of that same tide.
Strip that out and look at each deck’s growth relative to the tracked pool specifically, and the picture shifts some. Cad’s own relative growth is real, but it’s modest, something like 8% a week. Meanwhile Ahsoka Tano / Blue 30 is climbing at something like 44% a week in relative terms, and Greef Karga / Data Vault is climbing even faster, north of 47%.
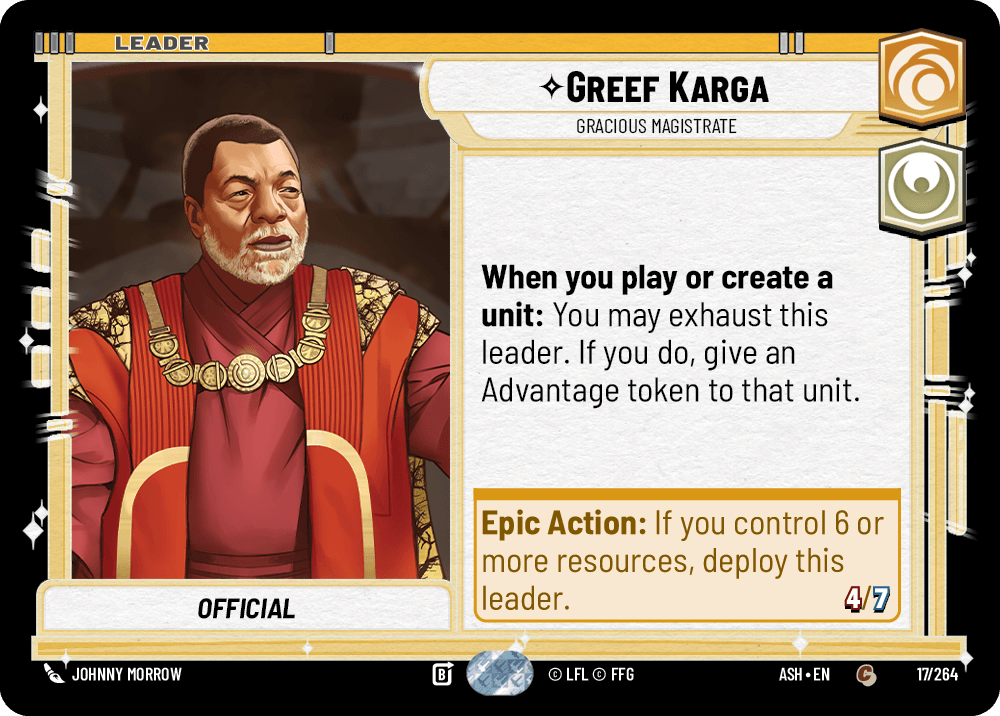
It’s worth being precise about which Greef, because there are two builds in the data and they are not telling the same story. Greef Red 30 is the one you’ll see if you just eyeball a trend chart — strong into Yellow builds, but sitting under 50% against Cad Blue and landing in Fade tier overall (47.6% against the field). Greef Data Vault is the quiet one getting less focus. Even better, it’s the build actually carrying the archetype’s name into serious Top 8 consideration, sitting at Top Pick tier and 54.4% against the field.
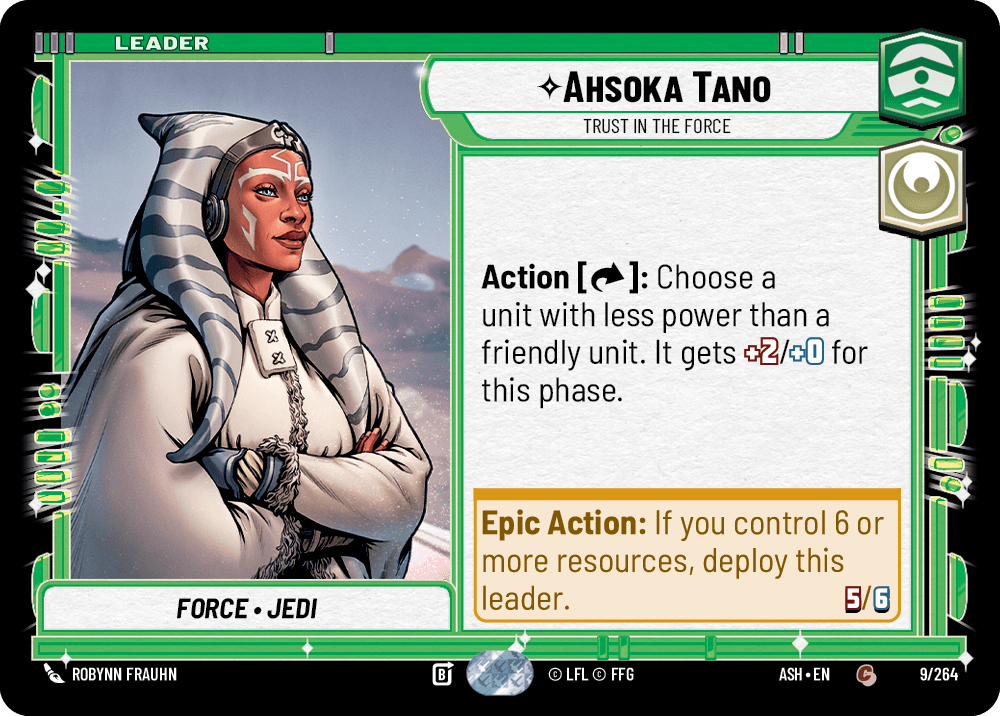
Ahsoka’s still Developing tier rather than a proven winner — 50.9% against the field is solid, not scary — but the trajectory is the story here, not the current win rate. She’s rising fast enough that “Developing” probably doesn’t describe her for much longer.
Projecting the Field
Before the numbers, quick plain-language version of what these stats actually are, since I use them a lot below. Starting field share is just what fraction of the room is expected to sit down with each deck on day one, using current play trends rather than a frozen snapshot. From there, the model simulates each deck playing out its matches against that field using real matchup win rates, and narrows the field round by round the same way an actual tournament does, cutting players as they lose. What’s left after enough of that narrowing is a projected picture of who’s actually still in it deep into the weekend, not just who showed up with the most copies on day one.
One honest caveat before I show you the seed list: the format itself changed this year. The first chunk of rounds each day now mixes in Limited alongside the usual Constructed rounds, which is a real variable in how the event actually plays out and not something this model attempts to capture. I don’t have a good way to simulate a Limited round yet, so just know that’s a layer of real-world noise sitting on top of everything below.
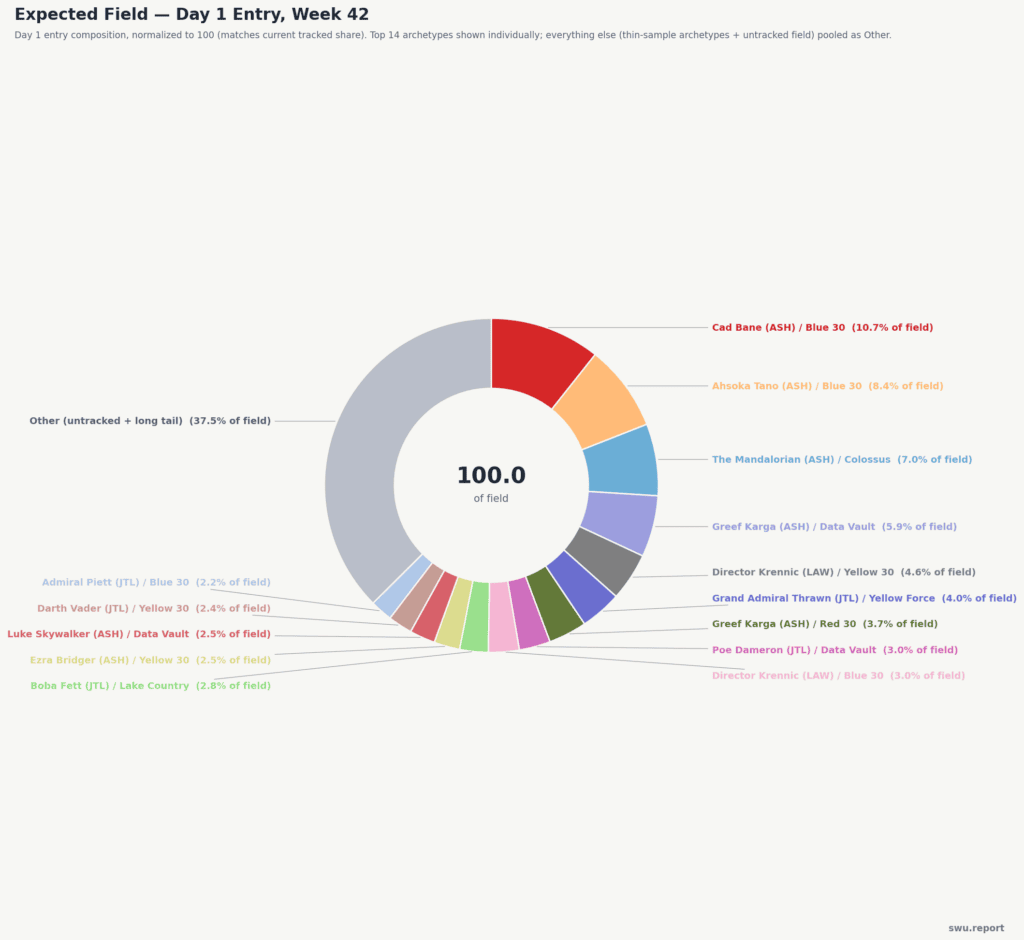
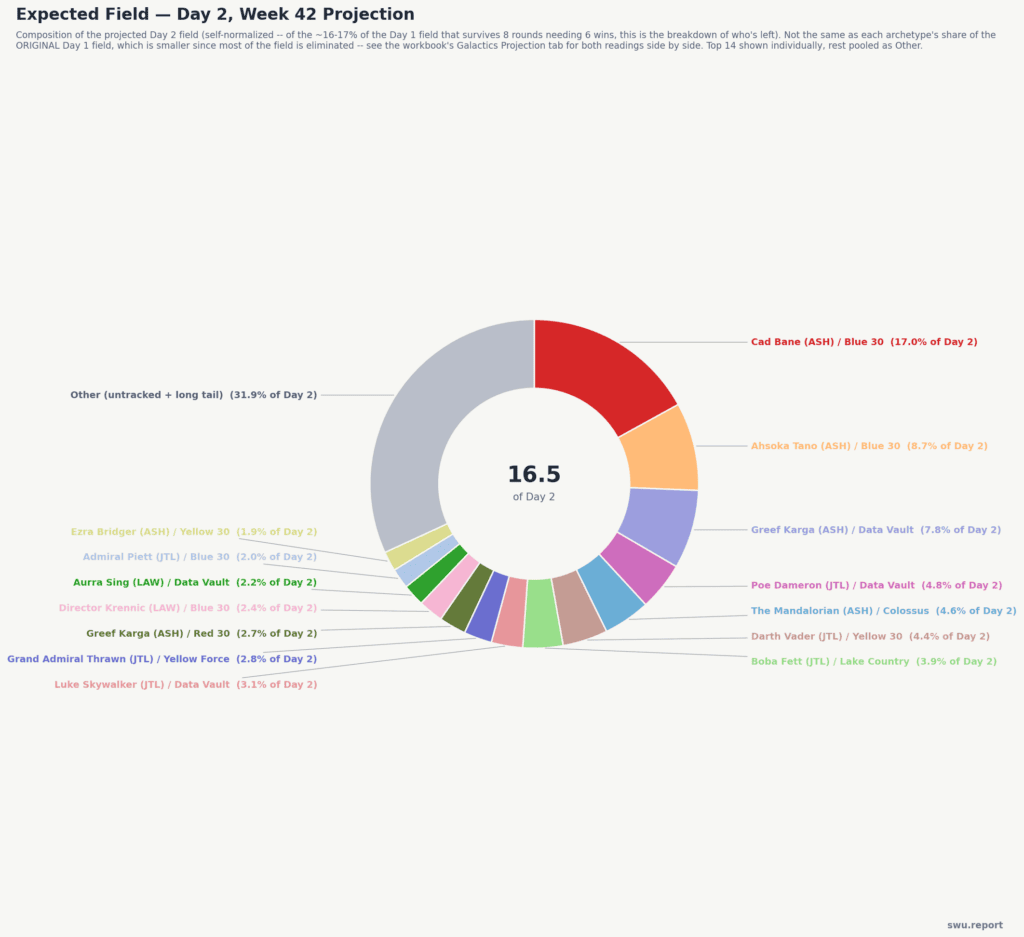
The Projected Top 8
With that said, here’s who the model has sitting in the final 8 seats — 8 real seats, apportioned the way you’d apportion any fixed number of real seats, largest remainder first, same method used for allocating legislative seats:
- Cad Bane (ASH) / Blue 30 — Two projected seats, as it turns out. Still the single most represented archetype in the room, even if he’s not the favorite once he’s sitting across the table from the right opponent.
- Wildcard: untracked deck — The room outside our 43 is still real, and it still projects a full seat on its own.
- Greef Karga (ASH) / Data Vault
- Darth Vader (JTL) / Yellow 30
- Ahsoka Tano (ASH) / Blue 30
- Poe Dameron (JTL) / Data Vault
- Luke Skywalker (JTL) / Data Vault
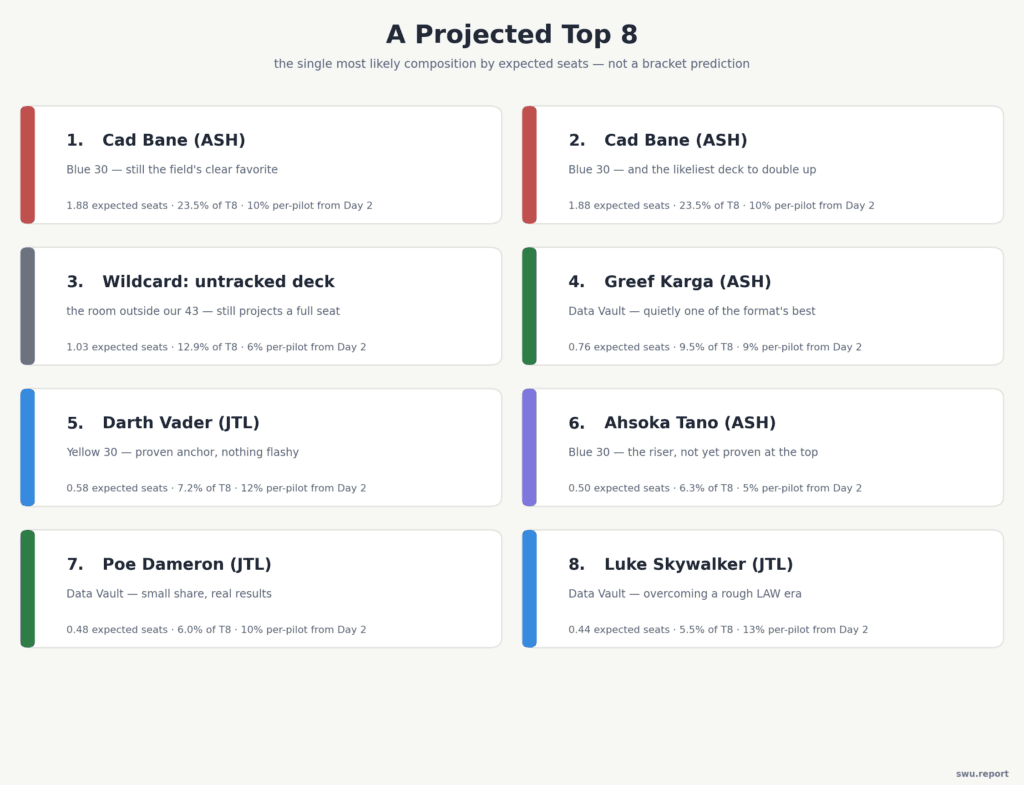
Here’s the twist. Take that seed list and run a Monte Carlo simulation on it (basically, rather than trying to calculate the one true answer by hand, let the computer play out the bracket a random way, using real win rates to decide each match, then do that again, and again, three hundred thousand times, and see who ends up winning most often). Cad Bane reaches the final in roughly half those simulated brackets, which makes sense given he’s got two shots at it. He isn’t favored to win it, though. Luke Skywalker (JTL) / Data Vault takes the whole thing in 24.1% of simulated brackets against Cad’s 23.4%, and the reason is exactly the matchup flagged above: a real, 194-game-sample 66% win rate over Cad Blue is enough to outweigh the raw volume advantage once the two of them are likely to actually meet.
A couple of alternate versions of that bracket, for good measure. I didn’t want to lean too hard on one specific seed list and call it the final word, particularly since we’re already stacking assumptions on top of assumptions to get here. So I swapped out a couple of seats and reran the same simulation to see how much the picture actually moves.
Drop the Wildcard slot and Poe Dameron, and the next two in line — Boba Fett / Lake Country and Lando Calrissian / Lake Country — step in. Cad still reaches the final close to as often as before, but he’s no longer the title favorite. Lando is, at 23.1%, with Cad right behind at 20.6%.
Drop the two lowest win rates in the field instead — Ahsoka Tano and one of Cad’s two seats — and the same two names step in. Lando’s the favorite again, 23.4%, and this time Cad’s reduced to a single seat and drops all the way to 10.7%. Losing that second seat costs him more than losing any single matchup does.
Run it three different ways and Lando shows up as the favorite in two of them, every time the moment he actually gets a seat instead of needing to fight through a nearly empty pilot pool to earn one. That’s about as strong a confirmation as I can offer for the sleeper call a bit further on.
Putting APR to Work Before the Event
A quick aside on why this section exists at all: Alex and I didn’t touch APR on the podcast, because I hadn’t actually run it yet when we recorded. It struck me afterward, working on this piece, that if I’m going to keep pushing Adjusted Performance Rate as the right way to read a tournament after the fact, I should be willing to point that same tool at a projection before one too. So here’s what happens when you run the real APR methodology from the original Vegas piece (Conversion Rate [eww]], Performance Rate, and the log-scaled Adjusted Performance Rate) against the projected field at a hypothetical 600-player Galactics, using the 8 real Top 8 seats.
This one reshuffles things at the top end more than I expected going in. A few things jumped out:
- Every one of the 7 real seat-holders posts a positive Overall APR. Every other archetype in the tracked field, all of them, is negative. No middle ground, no partial credit. You either get a seat or you don’t, so this shows the limitations of APR at the top end of a single event. Tracking over time is smoother, but I wouldn’t count this out.
- Luke Skywalker (Hero of Yavin) posts a monster +225.8% Overall APR, more than double anyone else in the field. If I’d led with one number from this whole exercise, it’d be that one.
- Split it into the two stages and Cad Bane’s story gets sharper, not muddier. He’s got the single best Day 1 -> Day 2 number of the group (+38.5%), legitimately the best at just surviving the first cut. But his Day 2 -> Top 8 number (+29.5%) is the worst of the six named seat-holders, and Luke, Vader, and Poe all more than double it. Same conclusion the bracket sim reached from a completely different angle: Cad gets there. He’s just not the best once he’s there.
- Ahsoka’s a wrinkle worth naming directly. Her Day 1 -> Day 2 APR is barely positive (+2.1%), the weakest of the six seat-holders, even though she’s been the loudest riser on every trend chart all month. Rising play share and rising performance are not the same claim, and this is about as clean an example as I’ve got of them quietly coming apart from each other.
- The Mandalorian now posts the single worst Overall APR of anything I’ve been tracking at -58.7%. Getting more popular and getting worse, in the same numbers, at the same time.
- Remember that Overall APR is a simple addition of multiple stages. If you’re examining this, it gives a reasonable picture of the performance of a deck for discussion, but if you’re really planning for a tournament, check what decks are likely to do as you cross each stage threshold (Day 1 -> Day 2, Day 2 -> T8, etc)
My Own Personal Call
All of the above is the model talking. Here’s me talking.
I’m not going to make it to Galactics this year, unfortunately. But if I were sitting down with a deck this weekend, I’d be on Darth Vader / Yellow 30, model be damned.
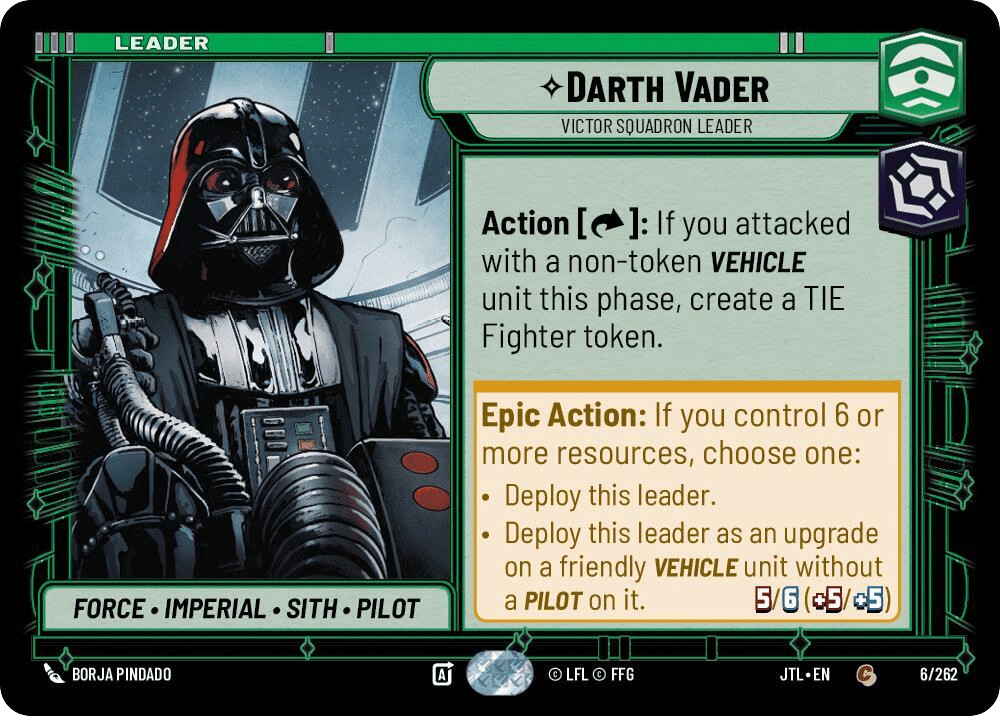
Part of it’s just reps. I’ve put a lot of games on this deck at this point, and it plays a straightforward enough game plan that it keeps the mental strain low across a long tournament and that matters a lot more than people give it credit for once you’re eight rounds deep and running on coffee and prayers. If my own tournament history has taught me anything, it’s that “straightforward” beats “clever” a lot more often than I want to admit. Part of it’s that Ashes gave the deck a couple of real interesting new tools that I think are still underappreciated. And part of it’s the matchup spread: he’s a real, checked 57.9% into Cad Bane Blue and 64% into Ahsoka, two of the seven named decks in that projected Top 8 above. That’s not nothing.
I won’t pretend it’s clean across the board. Luke Data Vault is a rough one for Vader (I’m not going to sugarcoat that one), and Poe leans the other way too. But if you can navigate around Luke, I like where this deck sits.
And now that I’ve actually run the APR numbers above, I like it even more than I did when I first wrote this section. Vader posts the second-best Overall APR in the entire field, behind only Luke. That’s truly not me picking a favorite and backfilling a reason — I wrote the reps-and-mental-strain paragraph before I’d run any of the APR math, and the metric came around to my side anyway.
And since we’re doing personal calls and not just what the model says: if Vader makes the Top 8, I’m calling him to win the whole thing. That’s a gut pick, not a math pick. The simulation likes Luke, and I’ve laid out why that’s defensible above. But put a gun to my head and ask me who’s hoisting the trophy, and I’m picking my own deck.
Two Names Worth Watching
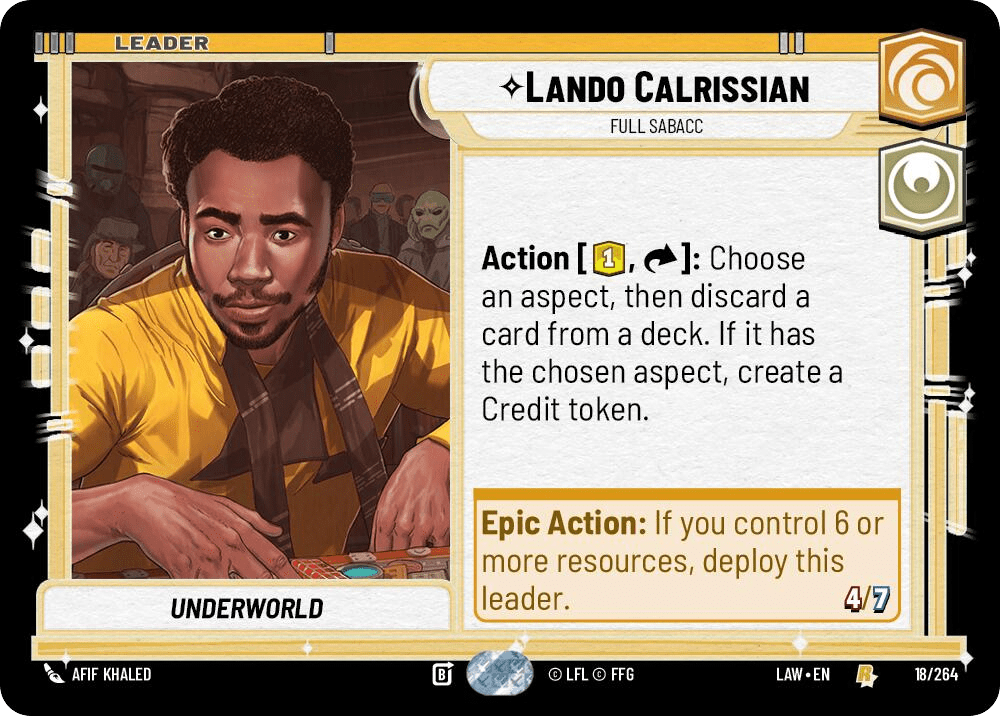
Lando Calrissian (Full Sabacc) / Lake Country: A proven LAW-era performer with one of the strongest APR growth stories from that whole season and right now it’s carrying the best win rate against the current field of anything we track, 61.0% on a real sample. Yet, almost no one is playing it. Half a percent of the tracked field this week.
Here’s where I have to be honest about something that bugs me a little. Run the whole-seat APR math above and Lando doesn’t actually hold a projected seat at all — he lands at -24.5% Overall. I want to be clear that I don’t think the numbers are wrong, exactly. I think something about the picture is incomplete. This is a deck with a legitimate LAW pedigree, an elite win rate on a real sample, and a field share barely worth mentioning, and that combination doesn’t sit right with me. Is the field sleeping on it? Are some pilots deliberately keeping it quiet online so it stays a surprise on paper, where it actually counts? Does an article like this one change anyone’s mind between now and this weekend? I don’t have a clean answer to any of those. What I do have is a personal call: whatever the numbers say right now, I think this deck gets played more at Galactics than any of this projects. Keep an eye on it.
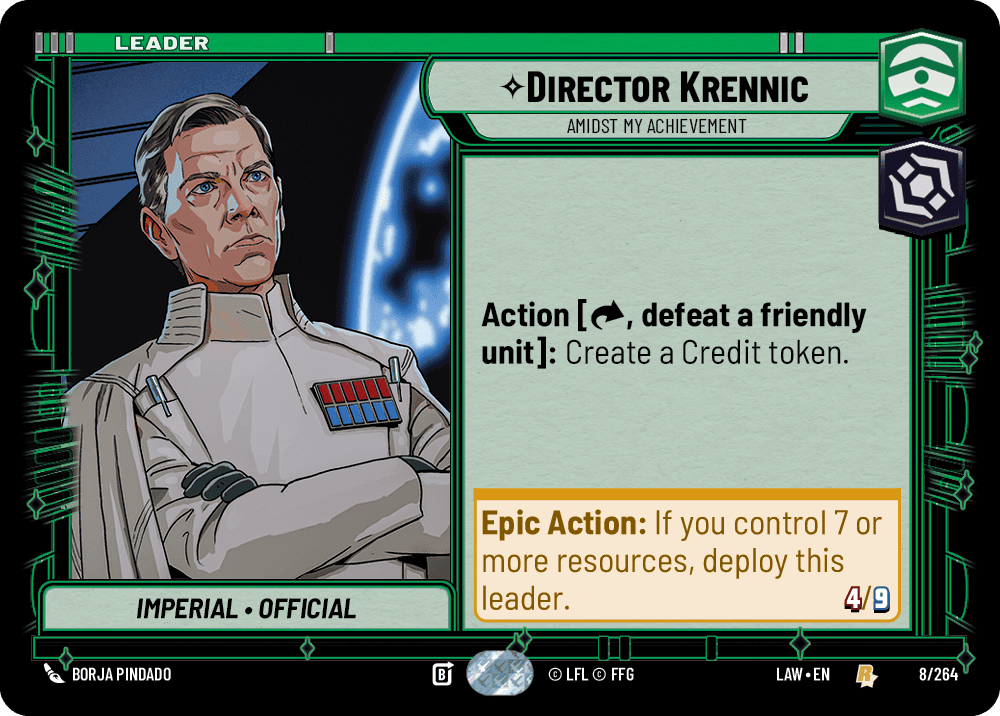
Director Krennic (LAW) / Yellow 30: The flip side. This is the deck that’s climbed the Karabast trend charts from nowhere over the past few weeks. It’s also, by the tier math, a trap. He’s – 38.6% against the field, and a LAW-era APR that was actually negative. The hype is real. The results backing it up are not there yet, and that gap between “popular right now” and “actually converts” is worth watching closely once the bracket rounds start.
One more seat worth a direct word: the untracked wildcard. It holds a real projected seat and it’s negative at every single stage of the APR math (-9.2%, -11.7%, -21.4%), which tells you it’s a seat built on sheer size, not on quietly beating expectations somewhere. But I don’t read that as nothing. That bucket is standing in for a lot of decks that are real and just not something we can fully track individually here or predict, and history says exactly this kind of seat produces the actual story of the weekend more often than the spreadsheet gives it credit for. Kylo Ren / Tarkintown wasn’t exctly on everyone’s radar before it ran through Galactics last year. Lando / Lake Country wasn’t the story anyone expected walking into Atlanta earlier this year, either. I fully expect some team shows up this weekend with something new and groundbreaking that isn’t sitting in any of our 43 tracked archetypes right now, because it basically always happens.
My Dark Horse Hope
Speaking of decks that aren’t sitting in any of our 43 tracked archetypes — I’ve got one of my own, and there’s no data behind this one at all, just testing reps and a soft spot I never fully let go of: The Armorer.
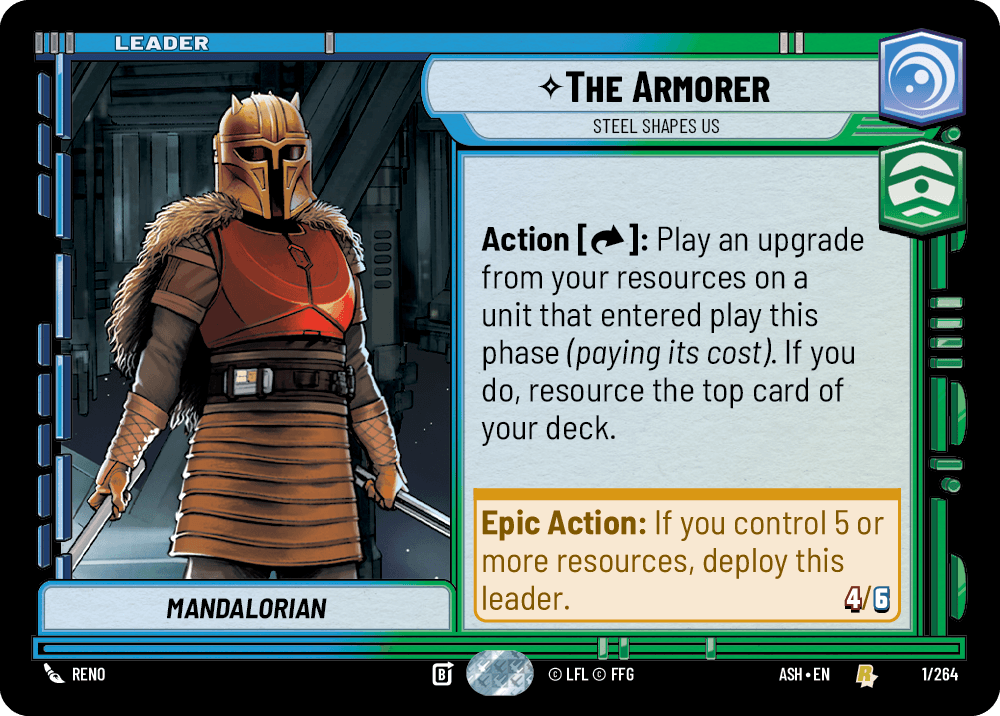
When the SWU-Tang Clan first started digging into Ashes, a few of us thought she had real potential. The card advantage her ability generates is huge over the course of a game, as long as you can keep using it steadily, and it’s not just raw card count either. Upgrades like Whistling Birds, Craving Power, even Heavy Blaster Cannon double as removal on top of the economy, and that compounds fast once it’s rolling. We had some crushing early testing sessions off the back of it.
Then reality set in some. She’s got real trouble keeping up with lane-dodging space aggro, and Cad Bane in particular has a way of offsetting the shield advantage the whole deck is built around generating. We shelved her in the end.
I still kind of hope somebody else cracks it before this weekend’s over and proves us right anyway.
What’s Yet to Come
So what didn’t make it into this piece? A handful of angles that deserve their own treatment before or after the dust settles this weekend:
- The Cad mirror. With two of the projected eight seats both on Blue 30, what does a Cad-into-Cad match actually look like, and does either side have real tools to break serve?
- Piett as a quiet Cad-proofing pick. Shows up positive against both Cad builds without any of the hype Luke or Boba get. Deserves a deeper matchup-spread dive on its own.
- Whether the Limited rounds end up mattering more than anyone’s accounting for. I flagged above that I’m not modeling it, but if it swings even a handful of records each day, that’s worth a real look after the fact.
- How Overplayed-tier decks tend to do once a harder qualifying format filters out the hype-chasers. More of a structural question than a stats one, but it’s the natural follow-up to the Cad conversation.
- The self-fulfilling-prophecy problem. No model answer for this, but it might make for a good roundtable with other creators once the results are in and we can check what actually happened against what the numbers said should happen.
Cad’s still the deck to beat by volume. He’s just not the deck the math says you should be most scared of once you’re actually sitting across from him. Only time will tell how any of this shakes out on the actual floor, but I feel confident the data’s pointed us somewhere useful. Good luck to everyone traveling this week, and I’ll have a full recap once the dust settles.
What’s in the Spreadsheet
I’m posting a OneDrive folder link with several of the charts from this piece and more plus a summary spreadsheet workbook breaking down the key stats, in case you want to dig in yourself.
Galactics Projection Charts and Summary
Here’s a quick tour of the tabs if you open it up:
- Galactics Outlook: Every tracked archetype in one table: share by week, win rate against the field, tier, LAW pedigree where it exists.
- Matchup Matrix: The full grid, every archetype’s win rate against every other one we track. I think some foks will want this one.
- Power Ranking: The Outlook sorted by win rate, plus each deck’s single worst matchup so a strong overall number can’t hide one bad pairing.
- Cad Bane Counters: The matchup breakdown against both of Cad’s builds specifically, sorted toughest-in first.
- Galactics Projection: The Day 1, Day 2, and Top 8 percentage/seat breakdown.
- Monte Carlo: Title Odds and Final Table Odds for the base T8 scenario, as well as both of my alternates.
- Projected APR: The CR/PR/APR breakdown using the figures from the Galactics Projection.
