

Welcome back again to the SWU Report! I’m hoping to hit at least one article per week of some kind, and boy do I have a doozy today! Time to recap the Galactic Championship Weekend, but this time from an angle that I haven’t seen tackled so far. And yes, based on my nickname, I really couldn’t resist the pun in the title here.
So now the dust has settled from the inaugural Star Wars Unlimited Galactic Championship in Las Vegas, and wow were there some interesting results. With nearly 2,000 pilots in the Galactic Championship battling through Day 1 down to just 73 survivors on Day 3, this tournament gave us our most comprehensive look yet at what separates championship-caliber strategies from weekend warrior pipe dreams. And while we’re at it, don’t forget the nearly 600 competitors at the Galactic Open!
When Statistics Meet Starships
Let’s start with the bantha in the cantina: Filip Szkudlarek’s Mother Talzin / Red Force base control deck claimed the championship trophy, defeating Ian Klein’s Kylo Ren / Tarkintown base build in a thrilling final. But here’s where it gets spicy – Mother Talzin’s statistical performance throughout the tournament tells a fascinating story about the difference between raw power and clutch performance under pressure. And it may not play out the way you’d expect.
The runner-up finish by Kylo Ren | We’re Not Done Yet wasn’t a statistical fluke, though. With the metrics that we’ve calculated, this deck actually had some of the most impressive stats of the entire tournament. But the real kicker? Mother Talzin / Red Force decks don’t top these stats at all. Sometimes the heart of the cards beats the spreadsheet.
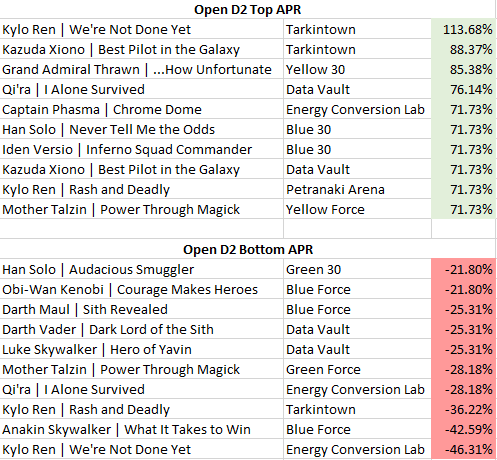
Also, just a note before we get into these. For simplicity’s sake I’m going to chat mainly about Championship Day 2 into Day 3 numbers as I feel that any of the 73 players that made Day 3 were capable of taking the crown, but these stats can be figured (and have been) for any of the various tournament breakpoints such as Galactic Open Day 1 into Day 2 and so on.
The Conversion Rate Trap
Most tournament analysis that I’ve seen so far in Facebook groups, video coverage, and more stops at Conversion Rate. That is just a simple percentage of pilots who successfully crossed each tournament threshold. For instance, most folks are talking about the Day 2 to 3 Conversion Rate of various decks. For instance, Han Solo | Never Tell Me the Odds / Tarkintown scores an impressive 100% Conversion by sending the single pilot at the start of Day 2 on to Day 3. But here’s the problem with relying solely on conversion metrics: they don’t account for field representation.
Consider this conundrum: Pre Vizsla achieved a perfect 100% Conversion Rate with 1 total pilot advancing to the final day after starting with 1, while Han Solo | Worth the Risk / Blue Force managed only 9.23% Conversion Rate despite fielding 130 pilots to start Day 2. Raw conversion rates would suggest Pre Vizsla is the superior choice, but any experienced pilot knows that’s not the whole story. Conversion Rate fails to normalize for field size differences, making it nearly impossible to compare strategies with vastly different representation levels.
Think of it this way, any deck that is extremely highly represented in the field stands a greater and greater chance of being paired against itself and when only one of the two players can win and move on, that can have some measure of self-cannibalizing effect. That same Han deck started out with 23.9% of the entire field at the start of Day 2, which is a very hefty share! At the other end of the scale, a deck like this Pre Viszla which only saw a single representative (who also had a bye and didn’t have to make it through Day 1) can skew things pretty hard based on pilot. Sure, that 100% Conversion Rate looks a heck of a lot better than 9.23%, but can you confidently say that it’s the better competitive choice for most players?
Don’t get me wrong, Conversion Rate serves its purpose for evaluating threshold-crossing ability. But when you’re trying to identify genuinely competitive strategies versus statistical noise, you need more sophisticated tools in your analytical arsenal.
So, for reference, that formula would be: CR = Day3# / Day2#
Performance Rate: Better, But Not Perfect
Enter a new stat that I’ve created, Performance Rate! Ok, ok, so I’m very certain that I didn’t come up with the concept here, but it’s not one that I see people discussing in SWU, so I’d like to take the chance to advocate for it a bit. So what is Performance Rate? It’s the percent change of a deck’s Field Representation from one tournament stage to the next. This metric reveals which strategies actually gain ground under competitive pressure versus those that fold as the tournament moves on.
The Vegas data showcases Performance Rate’s strengths beautifully. While Han Solo | Worth the Risk / Blue Force dominated the initial Day 2 field at 23.09%, watching his representation drop for Day 3 to 16.44% revealed the strategy’s limitations under pressure. Now you’re asking where’s the Performance Rate, though? Well, in this case, we can take the Day 3 Field % and subtract the Day 2 Field %, then divide by the Day 2 Field %, which gives us the rate of change. The closer we can get to 0%, the more a deck performed to expectations. So, for somewhat more round numbers, if Han was 25% of the field at the start of Day 2, we would expect him to still be 25% of the field at the start of Day 3. That would be a Performance Rate (change) of 0%. But instead, we see that he saw a -28.21% Performance Rate. He underperformed baseline.
By studying decks as a share of the entire field in each segment of the tournament, Performance Rate cuts through the popularity bias that plagues simple conversion analysis. When we calculate it, we’re measuring pure competitive efficiency. Pre Vizsla’s astronomical 671.23% raw Performance Rate for Day 2 to 3 immediately signals something significant happened, even if the sample size demands careful interpretation.
And of course, here’s the rub – Performance Rate still struggles with extreme sample size variations, particularly at the small end of that scale. Small-pilot strategies can generate massive percentage swings from single tournament results, while large-field decks require enormous shifts to register meaningful Performance Rate changes. A deck dropping from 4 to 2 pilots shows -100% Performance Rate, while another dropping from 200 to 150 pilots shows only -25%, despite the latter representing a much larger absolute change in pilots.
This is easier to mentally process at the under performing end of the scale as seen in the prior example, but as in the Pre Viszla example, positive performance of decks with very few pilots becomes more difficult to understand and compare to other decks in the field, even if they also had positive Performance Rates.
So, for reference, that formula would be: PR = (Day3% – Day2%) / Day2%
Adjusted Performance Rate: The Superior Metric
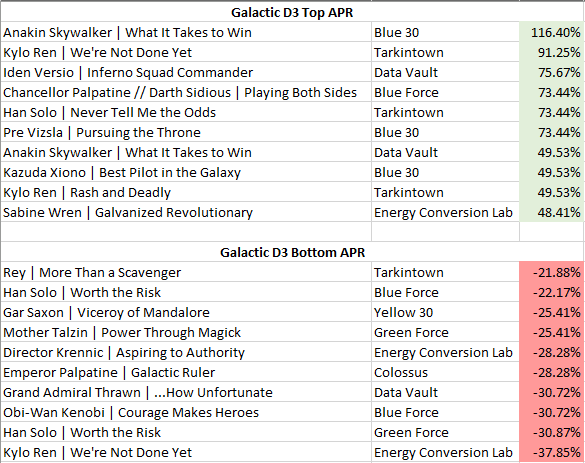
This brings us to Adjusted Performance Rate! Again, I want to take credit for this one, but I can’t entirely. Still, I’m really going to advocate for this one as the way that we should really be examining decks when we talk about large data points like Galactic Championship Weekend. This metric attempts to solve Performance Rate’s sample size bias through mathematical normalization. By using bracket adjustment formulas that scale results based on pilot counts, we can finally compare the Pre Vizsla phenomenon (73.44% APR Day 2 to 3) with established strategies like Sabine Wren / ECL (48.41% APR Day 2 to 3) on equal analytical footing.
The bracket adjustment formula creates a logarithmic scaling that acknowledges larger samples provide more statistical confidence while still allowing genuinely successful small-field strategies to register meaningful positive results. I’m telling you, this is the metric that separates signal from noise in tournament analysis.
Look at how Adjusted Performance Rate transforms our understanding of the Day 2 to 3 Vegas results: Iden Versio / Data Vault’s 75.67% APR with 3 total pilots at Day 3 represents a more reliable competitive signal than Pre Vizsla’s extreme but tiny-sample success. Meanwhile, the adjustment reveals that popular strategies like Han Solo | Worth the Risk / Blue Force (-22.17% APR Day 2 to 3) and Mother Talzin / Red Force (-15.76% adjusted) actually underperformed expectations despite their field dominance.
So, for reference, that formula would be: APR = PR * (log(Day2#+1)/(log(Day2participants+1))
The Vegas Revelations
The Galactic Championship data reveals some absolutely fascinating patterns when we drill down to the leader + base combination level- the true deck identity that competitive pilots actually play. The championship paradox deepens when we realize that Mother Talzin | Power Through Magick / Red Force, despite representing 7.46% of the entire field (42 pilots Day2), posted a surprising -15.76% APR. Filip’s title run wasn’t just individual skill overcoming statistics; it was mastery of a systematically underperforming combination.
Perhaps the most stunning revelation from the comprehensive data is how dramatically base selection transforms competitive viability. We’re not just talking about minor percentage point differences; we’re seeing complete performance inversions based on leader + base pairings
Take Kylo Ren | We’re Not Done Yet as the perfect example: paired with Tarkintown base, this combination achieved a stellar 91.25% APR with 15 pilots converting 6 to the final day. The same leader with Energy Conversion Lab? A disastrous -37.85% APR with all 10 pilots failing to find a spot in Day 3. Base selection isn’t just deckbuilding – it’s competitive destiny.
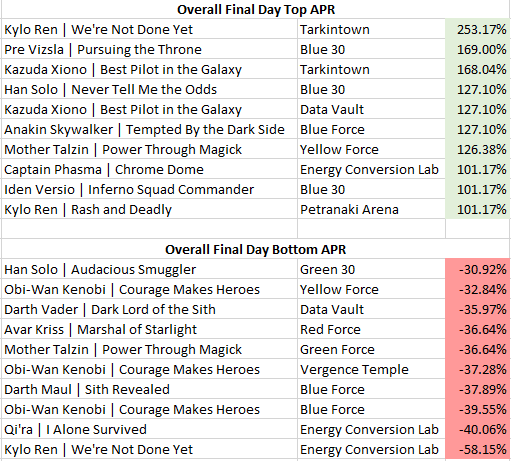
The hidden gems become even more compelling when we examine the entire weekend. Kazuda Xiono / Tarkintown posted 168.04% APR Overall GCW, suggesting this combination represents genuine untapped potential rather than statistical noise. Meanwhile, Captain Phasma / Energy Conversion Labquietly achieved 101.17% APR Overall GCW – a sleeper hit hiding in plain sight.
The Blue Force Paradox perfectly illustrates the popularity trap in competitive play. Han Solo | Worth the Risk / Blue Force commanded 17.13% of the entire tournament field for the weekend (Championship + Open) – that’s 529 pilots! Yet it managed only a tepid 10.06% APR Overall. This wasn’t a deck failing to meet expectations; this was a deck systematically underdelivering at scale. Meanwhile, significantly smaller Blue Force pairings like Iden Versio / Blue 30 quietly posted triple-digit adjusted performance numbers for the weekend.
Data Vault’s quiet excellence reveals itself when we examine the adjusted performance metrics. Qi’ra / Data Vault achieved 65.89% APR Overall with substantial representation (74 pilots), suggesting this combination represents genuine competitive advantage rather than small-sample variance. The base consistently enabled leaders to punch above their weight class throughout the tournament.
Top / Bottom Leader + Base Combinations (by Adjusted Performance Rate)
Parting Thoughts: The Meta Efficiency Paradox
The comprehensive leader + base data exposes a striking paradox in competitive play: popularity and performance exist in almost inverse correlation. In fact, the five most-played combinations in the entire weekend, representing over 40% of all registered decks all delivered disappointing adjusted performance numbers, with only two being positive.
Han Solo | Worth the Risk / Blue Force was the most populous deck with 17.13% of the total weekend segments, but posted only a 10.06% Overall APR. Next up, Mother Talzin / Red Force saw 7.32% of the weekend field with a -12.15% APR Overall. Then Darth Vader | Victor Squadron Leader / Yellow 30 with 6.77% weekend field saw -14.09% Overall APR. Next Han Solo | Worth the Risk / Green Force with 4.99% weekend field saw a whopping -29.19% underpformance by Overall APR. And finally, Cad Bane / Tarkintown with 4.86% of the entire weekend field segments managed only an anemic 6.14% Overall APR. These are terrible rates from strategies that dominated tournament registration but systematically failed under competitive pressure.
Meanwhile, combinations like Kylo Ren We’re Not Done Yet + Tarkintown (22 pilots, 253.17% adjusted performance) demonstrated that small, focused player bases often signal genuine competitive innovation rather than niche experimentation. The real meta wasn’t what filled the tournament hall, it was what quietly advanced through elimination rounds. This reveals a fundamental truth about competitive card gaming: accessibility and optimization rarely align. The most popular combinations become popular precisely because they’re approachable, familiar, and well-documented. But tournament success demands finding the combinations that leverage mechanical synergies over community